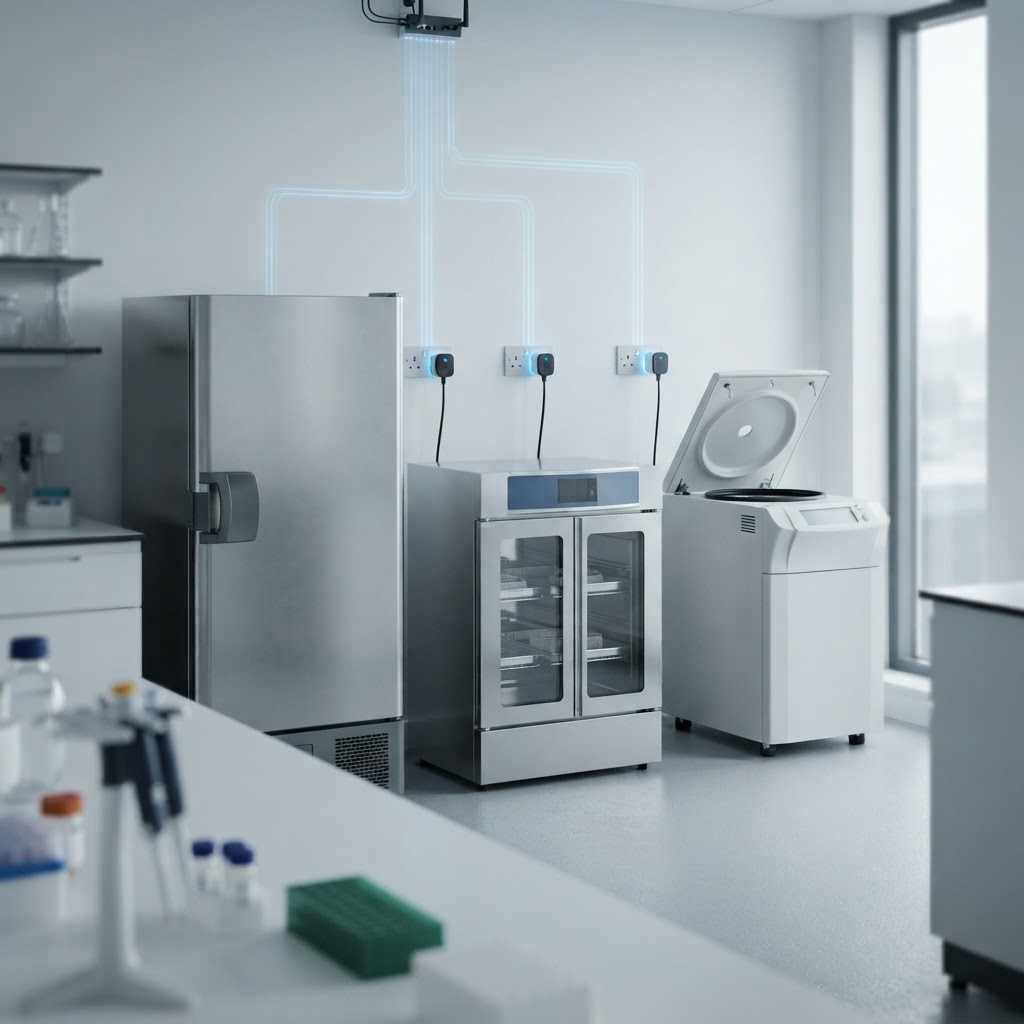
Data Logger has always been the add-on that keeps an eye on your lab environment. It records temperature, humidity, gas, pressure, light and switches around the clock, and raises an alert the moment something drifts out of range. But there was one family of signals that many laboratories asked for and could not see: the electrical behaviour of the equipment itself.
We are now introducing power plug tracking in the LabCollector Data Logger add-on. Place a monitored plug between the wall socket and any instrument, and LabCollector continuously records whether that equipment is running, how much power it draws, and how that consumption evolves over days, weeks and months. It is a single new capability that answers three questions labs ask every day: is it running, is it behaving normally, and what is it costing us?
Why Power Consumption Deserves a Sensor
Electricity is one of the largest operating costs of a laboratory. Ultra-low-temperature freezers, ovens, incubators, drying cabinets and air handling systems run continuously, and in most facilities nobody knows precisely what each one consumes. The overall bill exists; the breakdown does not.
At the same time, sustainability expectations have become concrete. Green lab programmes, freezer challenge initiatives, certification schemes and funding requirements increasingly ask laboratories to demonstrate their energy performance with measurements rather than estimates.
And there is the scientific argument: a change in consumption is one of the earliest visible symptoms of equipment degradation. A compressor that starts working harder, a seal that no longer holds, a vent that got blocked — the power draw moves first, the alarm comes later. Very often, the sample comes last.
LabCollector Data Logger now treats a power plug like any other monitored sensor: measured continuously, linked to an equipment record, and protected by thresholds and alerts.
What's New: Power Plug Tracking
Electrical parameters were already part of the Data Logger family — amps, volts, power, conductivity and electrical consumption. What changes with power plug tracking is the scale and the granularity: instead of monitoring a single supply point, you can now instrument individual pieces of equipment, one monitored plug at a time, and manage them all from inside LabCollector.
For every monitored plug, Data Logger collects its electrical state and consumption, stores the history, and presents it graphically for any period you choose. Because each plug is attached to an equipment record, every reading arrives already qualified: this freezer, in this room, owned by this team.

How It Works
- 1
Connect the monitored plug
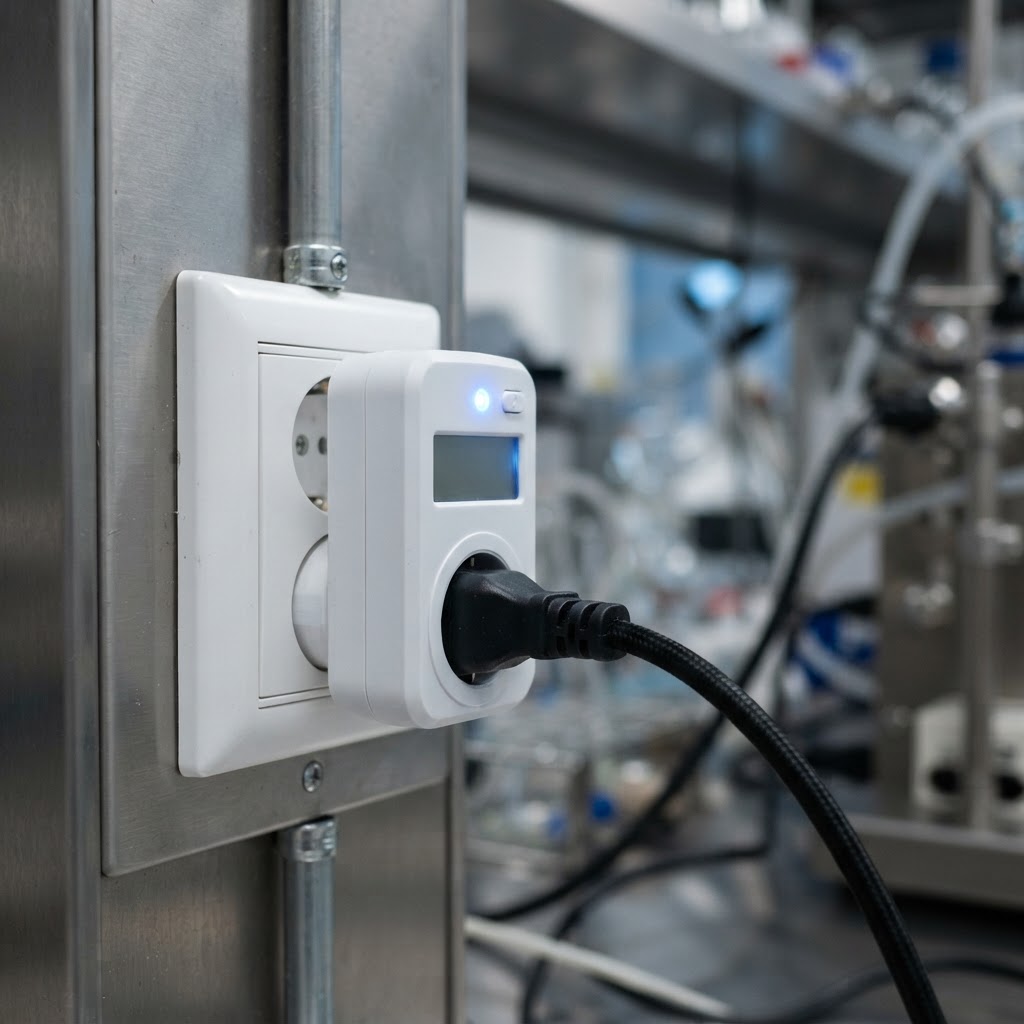
The meter simply sits between the wall socket and the equipment power cable. Nothing is installed on the instrument itself, so any equipment can be monitored — freezer, incubator, oven, centrifuge, drying cabinet, computer or shared bench station.
- 2
Link it to the equipment record
In LabCollector, each plug is attached to the equipment record (or the storage room, bench or instrument group it belongs to). Readings are no longer anonymous numbers — they carry an identity, an owner and a location.
- 3
Set expected values and tolerances
Define the normal consumption range for each instrument, then decide which deviations deserve an alert. A ULT freezer has a very different signature from an oven, a centrifuge or a workstation.
- 4
Monitor continuously, 24/7
Readings are collected around the clock and centralised in the LabCollector Data Logger add-on. Users retrieve the period they need, visualise it graphically, and export it for reporting.
The hardware comes from the same catalogue as the rest of the Data Logger ecosystem, so sensors, probes, loggers — and now power plugs — are managed within one system. For instrument-level data collection, plugs can also be combined with I-Collector Hub and the LabCollector LIMS modules.
Alerts in Both Directions
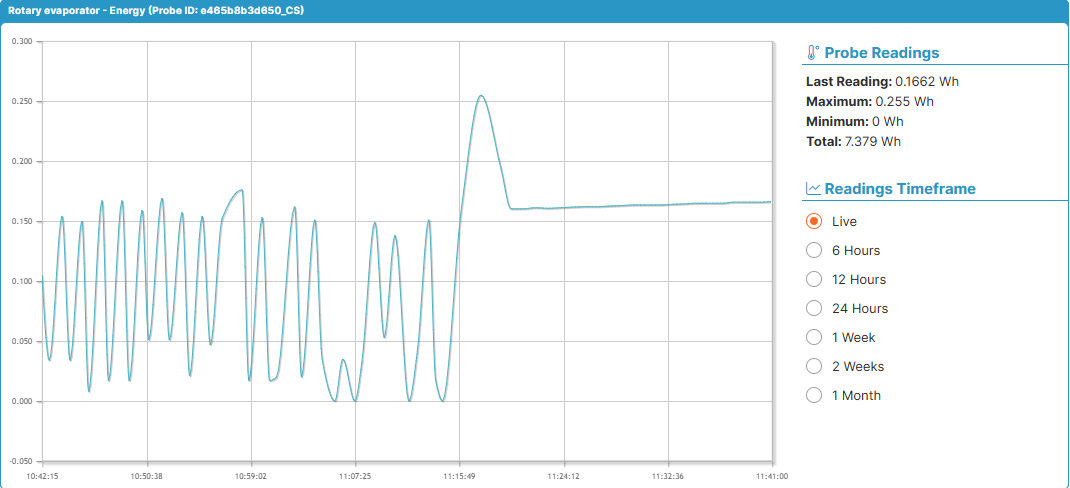
Power plug tracking is not only about reporting — it is about being warned at the right moment. Each plug can carry its own expected values and tolerances, and raise alerts when they are crossed:
Consumption too high
The instrument draws more than its normal range — an ageing compressor, a defective seal, a blocked ventilation path or a unit working outside its duty cycle.
Consumption too low — or gone
An instrument that should be running draws nothing: tripped breaker, loose cable, socket switched off. You know about it in minutes, not on Monday morning.
Alerts follow the Data Logger notification model: email notifications directly from the add-on, and SMS when the NET/GSM logger or SMS gateway extension is in use.
What Laboratories Do With It
Cost attribution per instrument
See what each piece of equipment actually costs to run, and allocate energy consumption per lab, team, project or facility — instead of dividing an overall electricity bill.
Early warning on ageing equipment
A compressor that starts drawing more power, a door seal that no longer holds, a vent that got blocked: consumption drifts before the instrument alarms — and before samples are at risk.
Detect unexpected shutdowns
If an instrument that should be running draws nothing, the plug reports it. That covers a tripped breaker, an unplugged cable or a socket switched off by mistake.
Spot equipment left running
Identify instruments that keep drawing power overnight, on weekends and during shutdown periods — often the fastest source of savings in a lab.
Justify replacement decisions
Compare real consumption of an ageing unit against a newer model to build a factual business case for replacement, rather than an estimate.
Sustainability and green lab reporting
Freezer challenge programmes, My Green Lab certification, funding reporting and internal green-lab initiatives all require documented energy data — not approximations.
Key Benefits at a Glance
Per-instrument electrical consumption, continuously logged
On/off state of every monitored plug
Linked to equipment, storage and room records
Tolerance thresholds with email and SMS alerts
Historic graphs and period retrieval for reporting
No software installed on the instruments
Works with the Storage Accessories hardware catalogue
Available on desktop and mobile
Environmental and Energy Monitoring in One Place
This is where power plug tracking becomes more than a power meter. Environmental conditions, energy consumption, equipment records, maintenance history and storage data live in the same platform, so a temperature excursion and the instrument that caused it can be read together, by the same person, from the same graph.
It also completes the sustainability picture for laboratories already working on greener operations: the data behind a freezer challenge commitment, a green lab certification or an internal energy target comes from the same system that guarantees sample traceability.
Available Now
Power plug tracking is available in the LabCollector Data Logger add-on, with the compatible monitored plugs and sensors available from the Storage Accessories catalogue. Existing Data Logger users can start with a single instrument and extend the coverage at their own pace.
Want to see what your instruments are really consuming? Request a demo or contact the LabCollector team to review your equipment list and identify the plugs worth monitoring first.
 English
 French
 Spanish
 Portuguese
 Italian
 Polish
 German
 Dutch
Dutch Danish
 Swedish
 Greek
Greek Norwegian
 Finnish
 Romanian
 Hungarian
 Czech
Czech Slovak
 Hebrew
 Arabic
 Japanese
 Korean
 Ukrainian
 Latvian
 Turkish
 Croatian
 Chinese (Simplified)
 Bulgarian